
PART C · THE x4 THESIS
From €2,500 to €10,000 per hectare.
A fourfold increase in turnover over twenty years—not through the intensification of a single crop, but through system change. Three drivers, an anticipated and managed J-curve.
The central economic mechanics of the thesis.
The economic thesis is formulated simply: a regenerated agricultural estate can quadruple its turnover over twenty years, moving from a magnitude of 2,500 euros per hectare, characteristic of conventional agriculture, to a magnitude of 10,000 euros per hectare in a cruising regime.
The ×4 does not come from the yield of a single crop. It comes from a system change.
This multiplication does not stem from the intensification of a single production. No scientific study demonstrates a fourfold increase in the yield of a monoculture converted to regenerative—literature documents gains in the range of five to forty-five percent depending on the crops and contexts.
The ×4 comes from a system change. Three distinct but interdependent economic drivers combine to produce the multiplication. The thesis is not an optimistic projection: it is based on a documented scientific and operational corpus, presented on the Sources and Inspirations page.
Natural capital regeneration
The fundamental driver—the one that makes the other two possible. Biological soil restoration, water regulation, functional biodiversity, land valuation.
Driver 1 DetailsInter-enterprise biological synergies
Cross-gains that no monospecific operation can capture. Simultaneous action on both sides of the operating account: reduction of expenses, increase in products.
Driver 2 DetailsMix substitution
Concentrating value on a fraction of the surface area. Around ten percent dedicated to the most value-intensive enterprises can carry approximately half of the target turnover.
Driver 3 DetailsThe fundamental driver—the one that makes the other two possible.
Natural capital regeneration is the first driver, fundamental in the literal sense: without restored living soils, neither synergies nor mix substitution are possible. It is the foundation. It acts on four dimensions.
Soil fertility
Restoration of organic matter, biological activity, and the mycorrhizal network. Reduced dependence on synthetic inputs.
Water regulation
Multiplied retention capacity. The soil absorbs intense rainfall, resists drought better, and recharges aquifers.
Functional biodiversity
Pollinators, natural pest predators, microbiome. A biological infrastructure that reduces costs.
Land valuation
Measurable biological improvement of the soil translates into land appreciation—an order of magnitude of ×1.5 over twenty years.
The soil ceases to be a medium that depletes and becomes a living asset that appreciates.
Cross-gains that no monospecific operation can capture.
The second driver lies in the interactions between production enterprises. A diversified farm does not just juxtapose productions: it organizes their interactions so that each enterprise reinforces the others. These cross-gains are structurally invisible to monospecific studies; they only reveal themselves in an integrated system.
Agroforestry & animal welfare
Trees planted in livestock plots lower the perceived temperature by several degrees during heatwaves—a direct gain in animal productivity.
Poultry ranges in agroforestry
Poultry utilize a space already occupied by another function and generate an additional contribution to turnover, without dedicated surface area.
Grazed cover crops
Sown to protect the soil, grazed by the herd. They reduce feed costs and provide seasonal forage compensation.
Mixed crop-livestock farming
The integration of crops and livestock closes fertility cycles and reduces dependence on external inputs.
Concentrating value on a fraction of the surface area.
The third driver consists of introducing, on a limited fraction of the surface area, enterprises with very high added value. The logic is arithmetic: around ten percent of the surface area, dedicated to the most value-intensive enterprises, can carry approximately half of the estate's target turnover. These intensive enterprises do not replace extensive enterprises: they are added to them.
Already regenerated soil
Intensive enterprises require soil that is already regenerated—Driver 1 must have produced its effects.
Scaling up skills
Teams are gradually trained in the specific practices of intensive enterprises.
Market outlets
The construction of differentiated marketing channels takes several years.
If Driver 1 makes the system possible and Driver 2 optimizes it, Driver 3 is the one that transforms regeneration into measurable economic performance. Its progressive nature also explains the shape of the model's financial trajectory—the J-curve.
A five-phase trajectory, anticipated and managed.
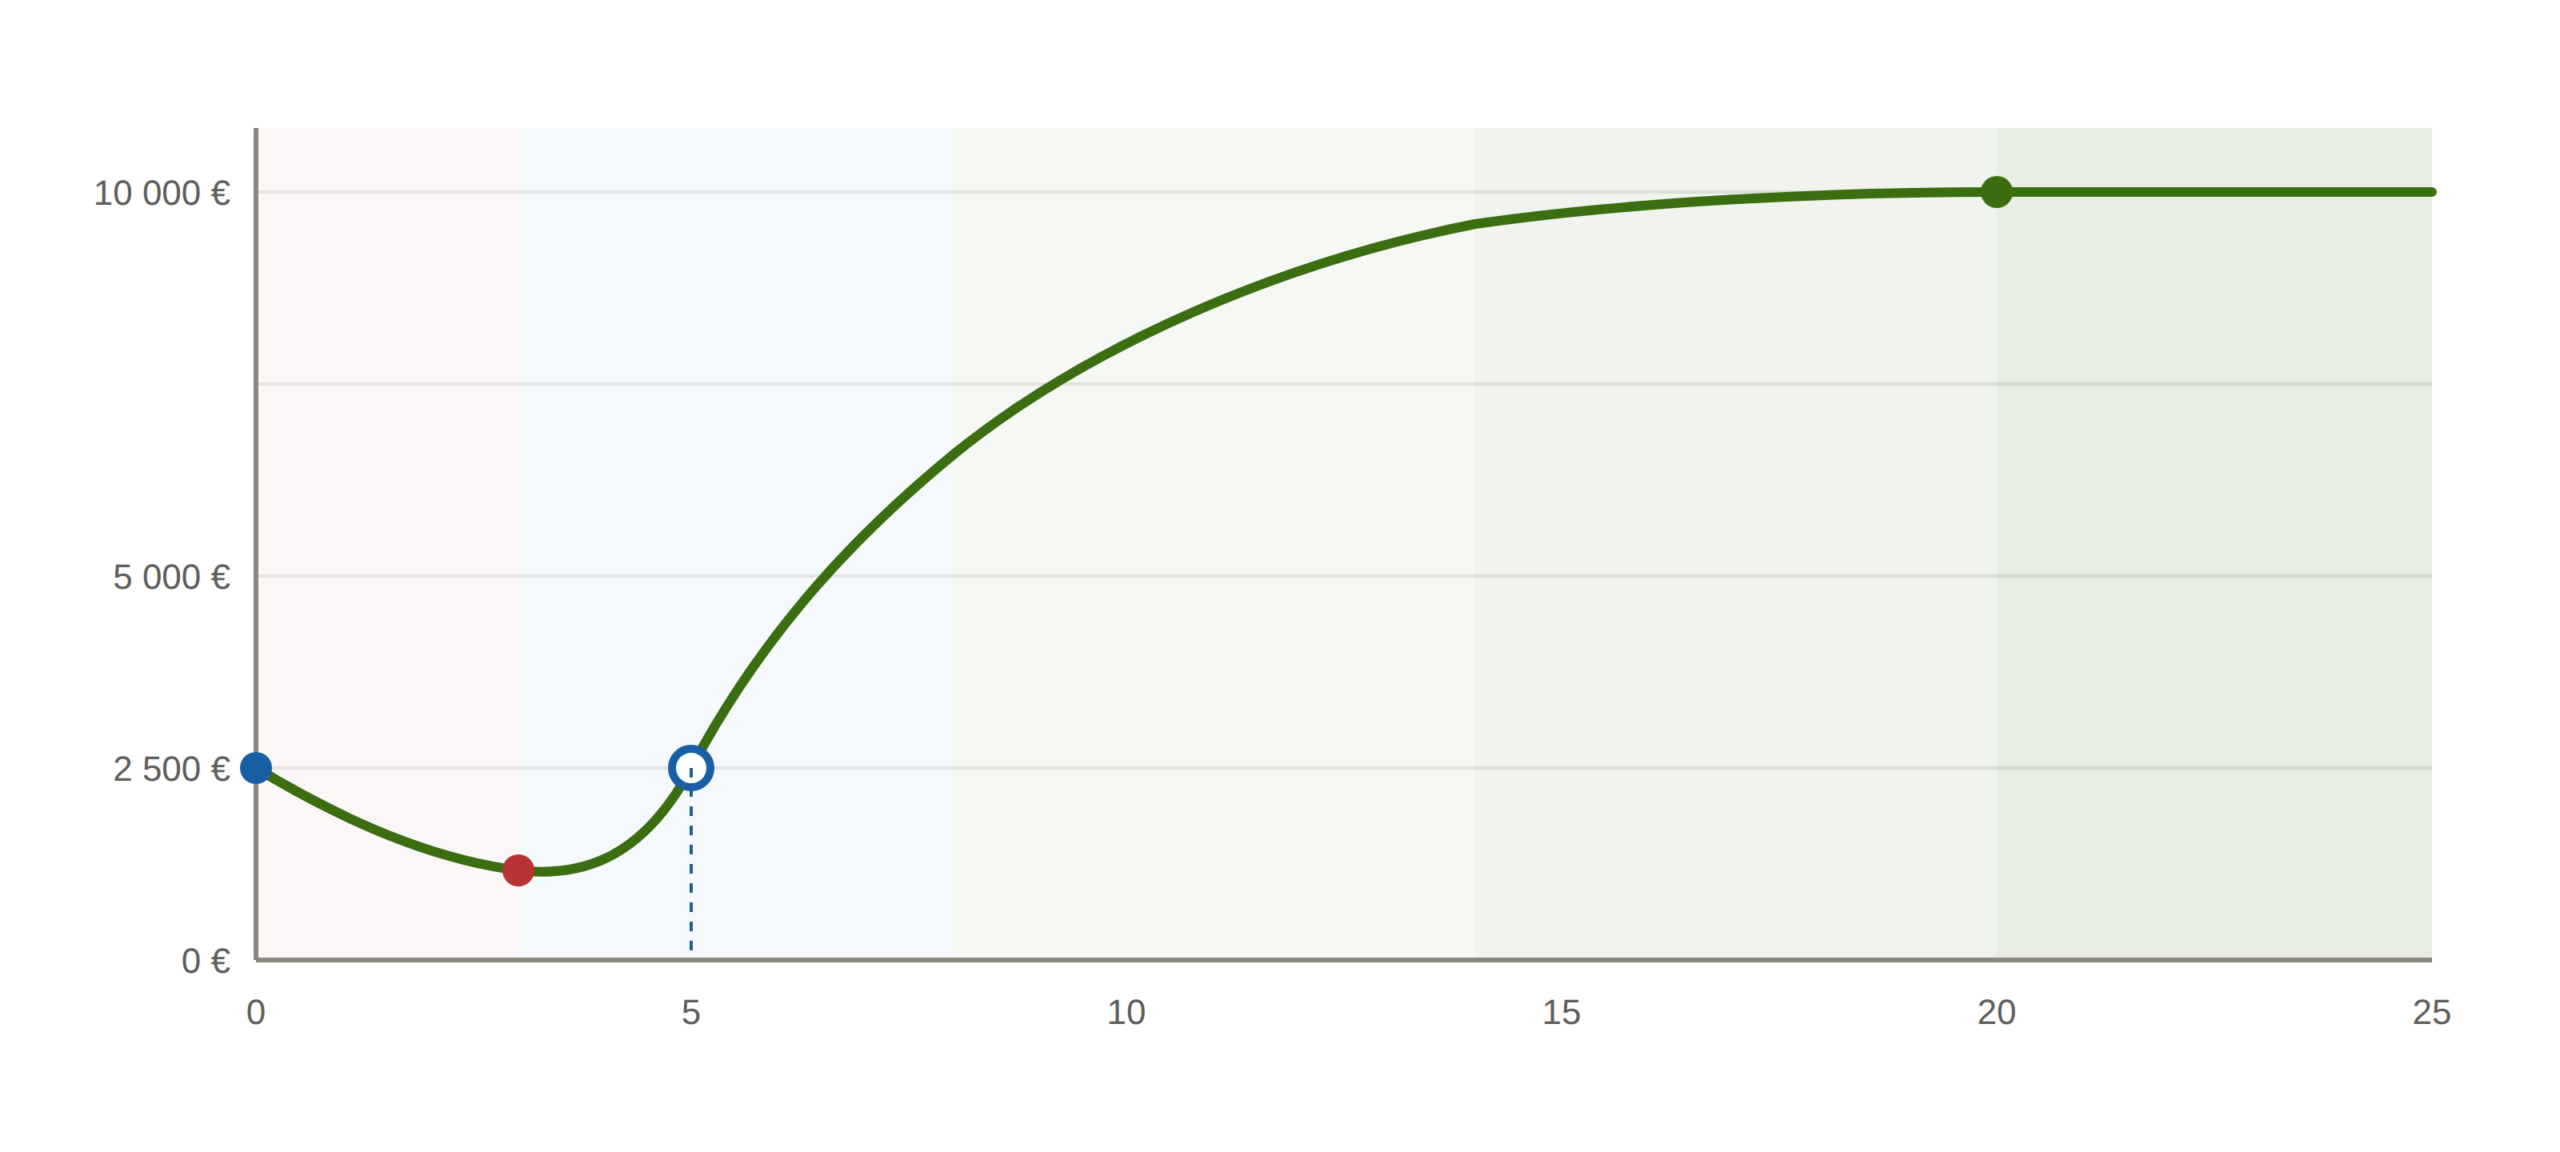
The financial trajectory of a regenerated estate does not follow linear growth. It describes a J-curve: an initial dip, followed by a progressive recovery up to the cruising regime. This shape is not a random occurrence—it is anticipated, financed, and managed.
Transition
The estate moves away from conventional practices; the mechanical structure of the soil collapses before biology takes over; turnover temporarily decreases.
Biological awakening
Soil life is reconstituted; turnover rises back above its starting level; break-even is reached around the fifth year.
Scaling-up phase
The three drivers are fully deployed; turnover grows strongly.
Stabilization
The estate approaches its cruising regime, towards the target of 10,000 euros per hectare.
Cruising
The estate operates at full biological and economic maturity.
The dip in the first few years is not an accident: it is the direct and anticipated consequence of the system change. The soil structure inherited from conventional agriculture is of mechanical and chemical origin; when regenerative practices are introduced, this artificial structure collapses before the biological structure is in place. This transition is inevitable, known, modeled, and financed from the project's inception. It is this anticipation that distinguishes a managed regenerative project from a forced transition.


